Powerful Jquery Chart Drawing Plugin —— jqPlot
by iiduce on 2009-06-17 10:21:46
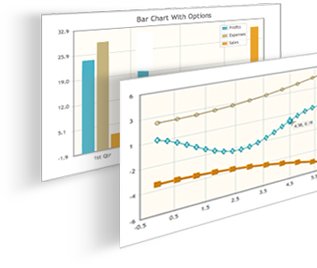
jqPlot is a chart-drawing plugin based on the jQuery library. With jqPlot, you can create various types of charts on web pages, such as line charts, bar charts, pie charts, and more. Moreover, jqPlot has plugin extensibility (Pluggability), which allows you to write your own chart styles. jqPlot has been introduced by someone before, and here I will mainly focus on introducing some of its usage methods and examples.